
The 20th century was a time of great technological change that forever transformed how we live and work – changes that necessitated the birth and development of the field of Process Safety Management. The early years saw the evolution of mechanization into assembly lines and true industrialization. Lack of access to South American nitrate during World War I, led to the creation of the synthetic chemical industry. World War II fostered increased industrial growth and sophistication. By the 1960s, we were building computers and beginning our race to the moon. Industries grew becoming increasingly sophisticated and reliant on automated systems. The 1970s brought the creation of the US EPA and OSHA. The 1980s witnessed one of the greatest tragedies in the last century – an estimated 4,000 people died in the 1984 Bhopal accident. Since then, the process safety community has evolved in its approaches and methodologies to better manage risks.
But what have we, as process safety professionals, learned from the experiences of the 20th century? How can we use that learning to make the process industry safer in the 21st Century?
20th Century Accident Data
Based on data from Lee’s Loss Prevention Handbook, 551 incidents occurred during the 81 years from 1911-1995.
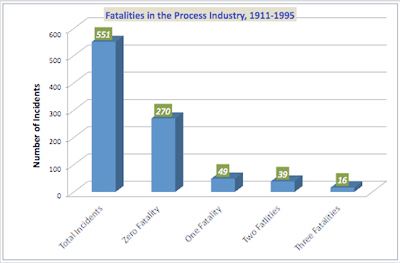
- Out of these 551 incidents, 270 (49%) resulted in a zero fatalities
- 374 (68%) of the accidents resulted in less than four fatalities
- 18 incidents (3% of 551) resulted in 100 or more fatalities
A more elegant way to analyze the accident data is to construct a fN curve, where f is the cumulative frequency of incidents leading to N or more fatalities.
In this fN curve,
- The first point represents the 281 incidents that resulted in one or more fatalities.
- The last point is the Bhopal accident, which is estimated to have resulted in 4,000 fatalities
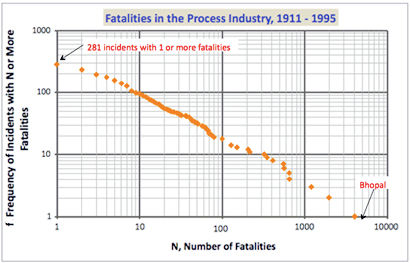
Based on the 20th century fN curve, we observe
- In the 1911-1995 time frame there were 100 incidents that resulted in 10 or more fatalities – an average of 1.2 incidents per year in which 10 or more people were killed.
- There were 18 incidents (3%) in which more than 100 people died – an average of 1 incident every six years.
- There were 3 incidents (0.54%) in which more than 1,000 died – an average of 1 incident every 28 years.
Prognosis for the 21st Century
How will the fN curve look for the 21st century? Without a crystal ball, a simplistic prediction is that the 21st century curve will be identical to the 20th century. So should we expect 551 process incidents again by 2099? As technology progresses, clearly it will impact the fN curve.Based on my experience, I’m going to propose a Saraf fN curve predicting fatalities in the process industry for the 21st century.
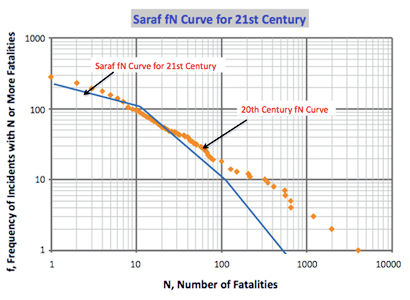
Here are my predictions regarding the safety performance of the process industry in our current century:
- There will be a drop in incidents that result in 1-10 fatalities because of increased hard hat safety requirements and awareness among workers due to better access to hazard communication and training.
- In the last century, 18 incidents resulted in 100 or more fatalities. This number will decrease in the 21st century as risk mitigation measures for high consequence incidents become more reliable.
- I believe the frequency of incidents that result in 10-20 fatalities will remain comparable. Such incidents are typically a result of human error, siting issues, proximity to community, poor plant design, and maintenance/inspection programs. Based on my understanding, I do not envision elimination of these key safety issues within a matter of a few decades. Zero incident plants are not a reality.
Final Word
Every decade in the 21st century, the process industry will witness an incident that will result in at least 10 fatalities.


5 Responses
Sanjeev
Really value the historical benchmarking. Question: while your 21st cent curve is a nice Nostradamic attempt backed by sound logic, what are your thoughts on the design curve that operators should design to? More realistic or more stringent.
nice Article Sanjeev.
Excellent work Dr Saraf.
I must disagree on one feature of your curve. I think there will be one super-incident in the 21st century. This will cause more deaths than Bhopal, giving your curve more of an “inverted S” shape.
My basis for predicting the super-incident? Mostly “gut-instinct” but consider …
+ Larger facilities being built in countries with severe poverty.
+ People living in poverty moving near these large facilities.
+ Lack of enforcement of government standards in these countries.
+ The need for profit – this drives issues like reducing training budgets and reducing maintenance budgets. We have difficulty catching up.
+ It adds up to the potential for an incident with a very large concentration of people can be more catastrophic than Bhopal.
I agree, systems are in place (and will be developed and enhanced with time) but one failure to comply creates the opportunity.
In summary Dr Saraf, good work, good article, and thank you for stimulating thought.
A good and thought provoking article. As the developed countries shift their hazardous and not acceptable manufacturing bases from their countries to developing and underdeveloped countries, with little respect for human life and economic necessities, it is likely that there will be many more Bhopal like accidents. The population growth around the factories can result in immediate and delayed fatalities in the cases of Bhopal like accidents.Persons may also die because of environment pollution where laws are not stringent or not enforced strictly.Some accidents may not be visible but still people may die due to handling / processing of hazardous wastes imported in some name.
In general, the article is good. However the estimate for reduction in catastrophic incident is very sharp. I argue all Process Safety professionals to react with Dr Saraf article and show their technical opinions.