
Basics
An operating asset, such as a refinery or oil and gas platform, poses risks to people and environment.
A quantitative risk analysis (QRA) quantifies operating risks.
Let’s get the math out of the way!
For quantification, risk is defined as product of frequency and severity.
Consider,
f = annualized frequency of an event (/year). e.g. return period for hurricane.
N = Number of fatalities associated with the event
F = cumulative frequency of N or more fatalities. So F corresponding to N=10 represents summed frequencies of all events resulting in 10 or more fatalities.
Once these numbers are quantified for all different events, there are several ways to represent the risks:
- Sum fN for all events. This is called expected value and represents fatalities/year from the operating asset.
- Plot FN and compare against a benchmark.
- Plot on the risk matrix based on frequency and severity.
Here’s QRA math explained using a simple example.
Frequency Data
In order to quantify risk, you need data annualized failure data. Typically, this is based on historic data. e.g. a pump leaks once every 15-years.
Sources of failure data
UK HSE Project RR1114 - Offshore accident and failure frequency data sources (HSE)
SINTEF Offshore blowout database (Sintef)
EGIG (European Gas Pipeline Incident data group) Pipeline data Eqiq
PHMSA Office of Pipeline Safety incident data for US pipelines
Pipeline and Riser Loss of Containment (PARLOC) database
Severity Estimate
Severity of a scenario is based on mathematical modeling or past incident data.
For quantifying risk of driving automobiles, you look at historic data to come up with an average N associated with an incident.
For hydrocarbon releases, fire and explosion hazard zones are estimated from the inventories in individual systems. The N is based on severity of hazard and population vulnerability. e.g. indoor vs. outdoor population
Risk Benchmarking
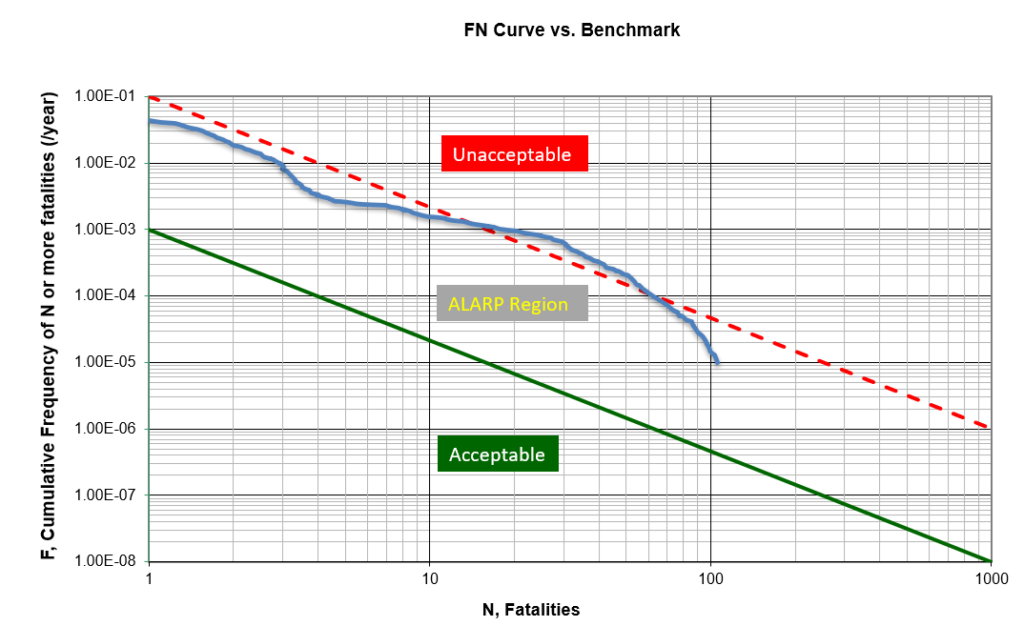
Once the risk from operating assets is quantified, usually it is compared against a threshold.
Risks can be reported as individual (risk profile for a individual) or societal (FN curve, number of people impacted).
One of the reasons FN curve was created was to provide ability to compare risks from different activities. e.g. farming vs. flying.
Very commonly, the risk numbers between the low and high threshold numbers are referred as As-low-as-reasonably-practical (ALARP).
One way QRAs get used particularly in countries mandating this approach is if you exceed the threshold, you try to lower the risk.
Environmental Risks
Risk to environment from operating asset can be quantified using a similar approach. Substitute N with severity of environmental release.
A million dollar oil spill poses a very different environmental leak than fugitive emission.
This needs some calibration either based on remediation costs or societal response.
Business Risks
Quantifying business interruption risk following a QRA scenario is not very common but can be done. Particularly, for insurance purposes.
To do this you need to replace N with a dollar figure.
Imagine a catastrophic scenario in a QRA. If you can associate a financial number based on loss of business, liabilities, asset damage, your expected value represents a probable loss. Similarly, you can also extract the maximum probable loss.
This becomes the basis of underwriting insurance or deciding on how much to insure.
The biggest issues about quantifying risks are incorporating facility specific data and correlated risks.
Cost benefit analysis
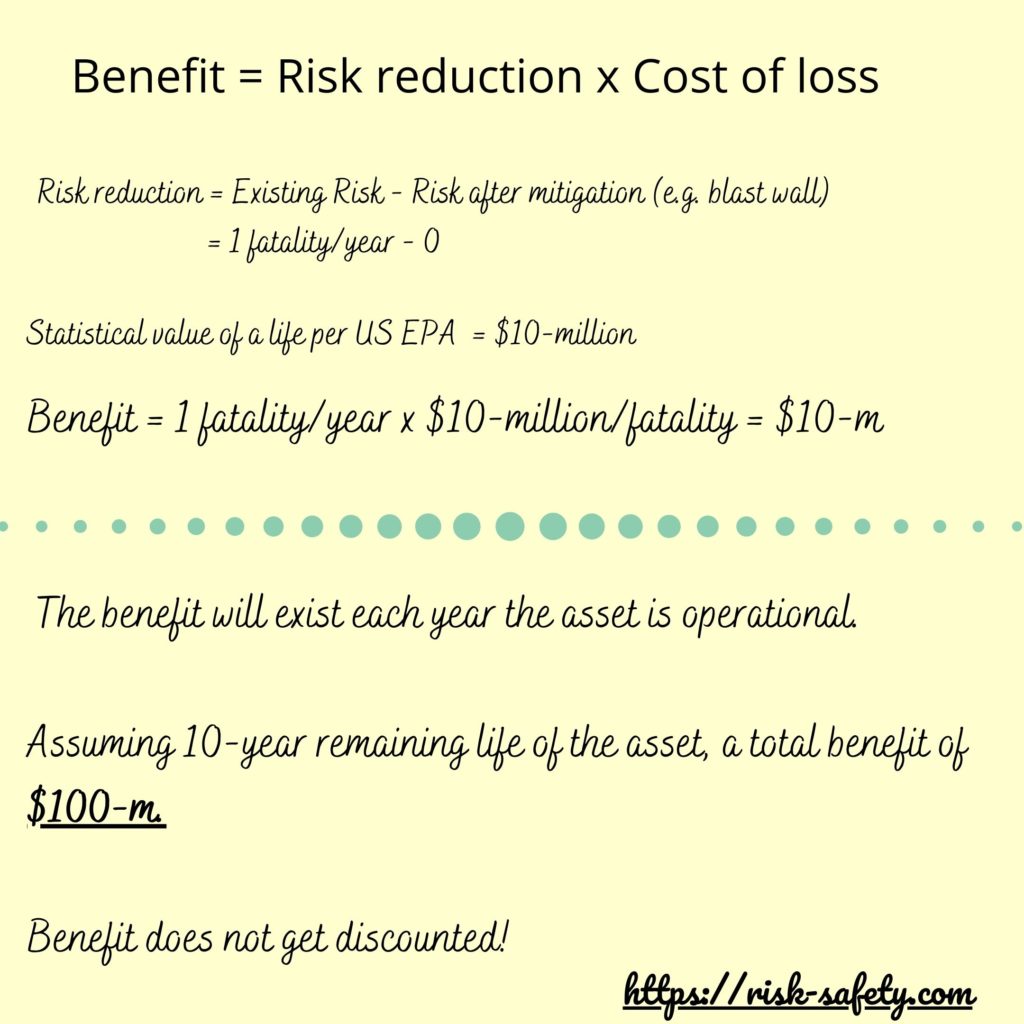
Risk reduction is the benefit you gain and is typically associated with a capital cost.
In order to quantify the benefit, need a value of life. EPA’s value of statistical life is about $10-million.
This benefit of risk reduction stays over operating life of the facility allowing you to estimate if the capital spend is justified.
Executive decision: allocating risk capital...which risks will you mitigate?
Continuing from previous post, here are the costs to mitigate the risks:
* Hurricane - $50-k, N= 4
* Explosion - $5-25-mil, N= 10
* Meteorite - $120-mil, N= 100
The statistical value of life is $10-million. The risk numbers are in the pdf.
Here's how folks voted on Linkedin:
http://bit.ly/cost_benefit_survey
Does lower QRA risk mean safer facility?
Not really!
The failure data used is “generic” and not specific to the facility. Think of the failure data as average asset across multiple sites is behaving. The historic data does not quantify the impact of the design, maintenance, and operations on the facility’s failure frequency.
Relative Risks: How to use QRA?
One way to circumvent, failure data and modeling deficiency is for decision involving relative risks.
For example, in trying to decide between two designs, a QRA will reveal the risk drivers.
Because you are making the same modelling errors, there is more confidence in relative risks rather than comparison against a fixed number.
Portfolio Risk Prioritization
Imagine you have a portfolio of assets: offshore, onshore, pipeline, drilling rigs.
Every year you have to make decisions about capital and resource allocation.
A QRA can help with the decision but needs a calibration of benefits and a framework to distribute capital among barriers.


2 Responses
Well done brief overview.
Great Introduction