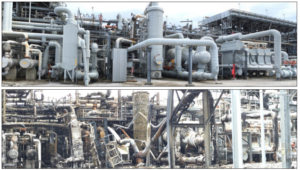
Below is summary (annualized average) of 20-year pipeline incident data from 1990-2009. [Source: Pipeline and Hazardous Material Safety Administration,PHMSA]
Summary of Pipeline Incidents in the U.S. [1990-2009]
| All Types | Hazardous Liquid | Gas Transmission | Gas Gathering | Gas Distribution | |
|---|---|---|---|---|---|
| Serious Incidents | 54 | 5 | 7 | 1 | 42 |
| Significant Incidents | 281 | 139 | 55 | 6 | 80 |
| Fatalities | 18 | 2 | 2 | 0 | 14 |
| Injuries | 8 | 9 | 9 | 1 | 59 |
PHMSA defines Significant Incidents as those incidents reported by pipeline operators when any of the following specifically defined consequences occur:
- fatality or injury requiring in-patient hospitalization
- $50,000 or more in total costs, measured in 1984 dollars
- Highly volatile liquid releases of 5 barrels or more or other liquid releases of 50 barrels or more
- liquid releases resulting in an unintentional fire or explosion
Serious incidents are the ones that resulted in injury or fatality. Thus all significant incidents encompass serious incidents.


